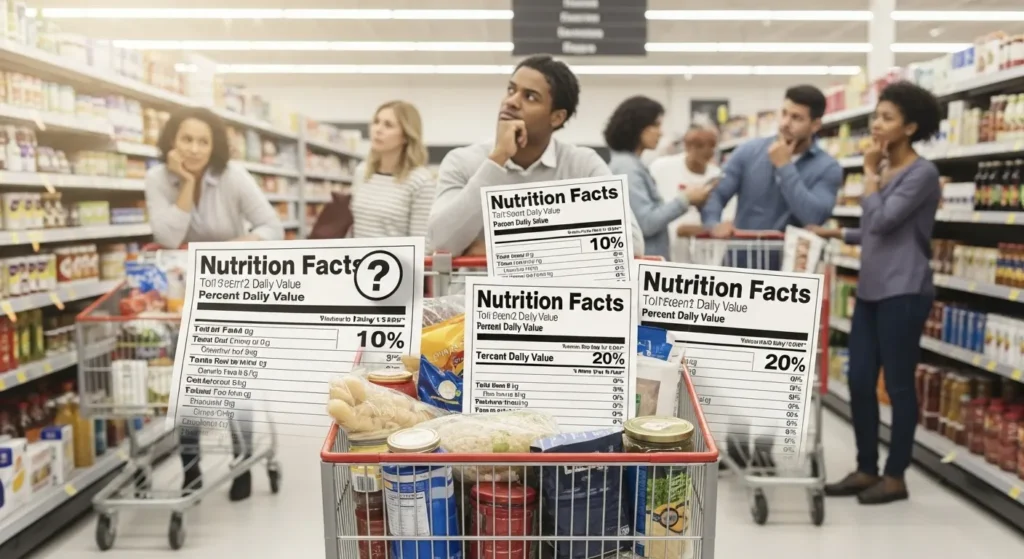
The Number That Looks Clear—Until You Try to Use It
You glance at a nutrition label.
You see:
- 25% Daily Value
- 10% DV
- 60% DV
It feels precise.
Scientific.
Reassuring.
But then the questions start:
- Is 25% good or bad?
- For one meal—or the whole day?
- Good for me or for someone else?
That’s the problem.
Percent Daily Values (%DV) look clear, but they rarely feel usable in real life.
What Percent Daily Values Are Supposed to Do
Percent Daily Values were created to:
- Provide context for nutrient amounts
- Help compare foods quickly
- Show how a serving fits into a daily diet
They are based on reference intakes set by regulatory authorities like the U.S. Food and Drug Administration, with population-level guidance often aligned with global nutrition discussions from the World Health Organization.
In theory, %DV should answer:
“How much of my daily need does this food provide?”
In practice, it often raises more questions than answers.
Why %DV Feels Scientific (Even When It’s Not Personal)
Percent Daily Values feel authoritative because:
- They’re precise
- They use percentages
- They imply personalization
But %DV is not individualized.
It’s based on:
- A standardized 2,000-calorie diet
- General population averages
- Broad nutrient assumptions
That means:
- Age, size, activity level, and goals are ignored
- Needs vary, but the numbers don’t
The math is clean.
The application is messy.
The Serving Size Problem That Starts the Confusion
%DV depends entirely on serving size.
And serving sizes:
- Are often smaller than what people actually eat
- May not match real portions
- Can vary wildly between similar products
So when a label says:
“20% DV of sodium”
It might only apply to:
- Half a bowl
- One cookie
- A fraction of the package
Eat more than the listed serving—and the %DV quietly doubles.
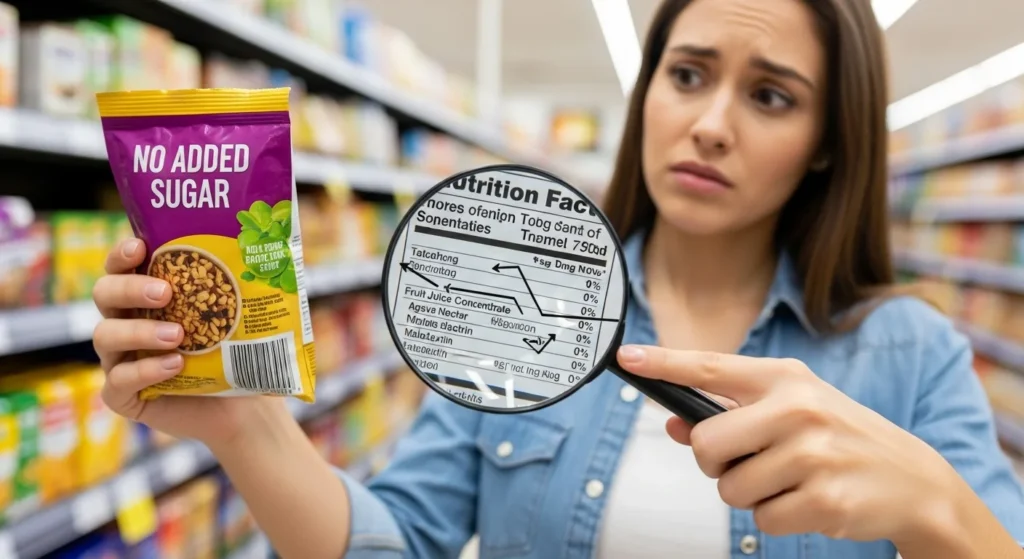
Real-Life Example: The Snack Bag Illusion
A snack bag lists:
- Sodium: 15% DV per serving
- Servings per package: 2
Most people eat the whole bag.
Suddenly:
- Sodium intake = 30% DV
- Without realizing it
The label wasn’t wrong.
But the experience didn’t match the math.
Why %DV Doesn’t Explain Balance
Here’s a core issue:
Nutrition isn’t additive—it’s relational.
Percent Daily Values show:
- How much of one nutrient you’re getting
They don’t show:
- How nutrients interact
- Whether the food is balanced
- How it fits with the rest of your meals
A food can show:
- High %DV for protein
- Low %DV for sugar
…and still be:
- Highly processed
- Low in fiber
- Unsatisfying
The numbers look good.
The context is missing.
The “Good vs Bad” Misinterpretation
Many people assume:
- High %DV = good
- Low %DV = bad
But that logic doesn’t always hold.
For example:
- High %DV of sodium → not ideal
- High %DV of fiber → usually beneficial
The same number can signal:
- A benefit for one nutrient
- A concern for another
Without guidance, %DV becomes a guessing game.
Comparison Table: What %DV Shows vs What People Assume
| %DV Shows | People Often Assume |
|---|---|
| % of reference intake | Personalized need |
| Per serving | Per meal |
| Single nutrient | Overall health |
| Standardized diet | Individual goals |
| Numeric context | Nutritional balance |
The gap between intent and interpretation fuels confusion.
Why %DV Feels Harder Than It Should
Percentages require mental math.
You have to:
- Track multiple nutrients
- Remember what you ate earlier
- Estimate what you’ll eat later
In real life, people don’t:
- Add percentages across meals
- Plan nutrition with calculators
- Think in 2,000-calorie blocks
So %DV becomes something people look at but don’t really use.
The Health Halo Effect of High %DV Numbers
When a food shows:
- 40% DV of calcium
- 50% DV of vitamin C
It creates a health halo.
People often think:
“This must be a good choice overall.”
Even if:
- Sugar is high
- Fiber is low
- Processing is heavy
The strong %DV distracts from other details.
Why %DV Works Better for Policy Than for People
At a population level, %DV helps:
- Standardize labeling
- Set regulatory thresholds
- Enable comparisons
At an individual level, it struggles because:
- Humans eat patterns, not percentages
- Meals aren’t nutrient spreadsheets
- Needs change daily
The system was built for consistency, not personalization.
Common Mistakes People Make With %DV
Mistake #1: Treating %DV as a Score
It’s context—not a rating.
Mistake #2: Ignoring Serving Size
Percentages depend entirely on it.
Mistake #3: Adding %DV Across the Day
That’s rarely practical or accurate.
Mistake #4: Letting High %DV Override Everything Else
Numbers can distract from food quality.
How to Use %DV Without Getting Confused
You don’t need to ignore %DV.
You need to use it selectively.
Actionable Steps
- Use %DV to spot extremes, not precision
- Compare similar products only
- Check serving size first—always
- Focus on fiber, sodium, and added sugars
- Think in meals, not percentages
This turns %DV into a guide instead of a trap.
Why This Matters Today (And Long-Term)
Food environments are more complex than ever.
People want:
- Quick decisions
- Clear guidance
- Less mental effort
Percent Daily Values promise clarity—but often deliver complexity instead.
Understanding their limits helps you:
- Reduce label frustration
- Make calmer choices
- Avoid number-driven anxiety
- Focus on patterns that actually matter
Nutrition becomes simpler when you stop expecting precision from percentages.
Key Takeaways
- Percent Daily Values are standardized, not personalized
- Serving size heavily influences %DV interpretation
- High or low %DV doesn’t automatically mean good or bad
- %DV shows context, not balance
- Using %DV as a rough guide—not a score—reduces confusion
Frequently Asked Questions
1. Are Percent Daily Values inaccurate?
No—they’re accurate within a standardized framework, but not individualized.
2. Should I track %DV across the day?
Most people don’t need to; it’s impractical and unnecessary.
3. Which %DV numbers matter most?
Fiber, sodium, and added sugars are often the most useful.
4. Why is %DV based on 2,000 calories?
It’s a reference point for labeling consistency, not a recommendation for everyone.
5. What’s better than focusing on %DV?
Looking at ingredients, food quality, and overall meal balance.
Final Thought
Percent Daily Values were meant to simplify nutrition.
But numbers without context often do the opposite.
When you stop treating %DV as a personal score
and start seeing it as a rough signal,
nutrition labels become less confusing—and far more useful.
Clarity doesn’t come from more math.
It comes from better perspective.
Disclaimer: This article is for general educational purposes and does not replace personalized nutrition or medical advice.