The Label Looks Honest — But Something Feels Off
You pick up a packaged food.
You turn it around.
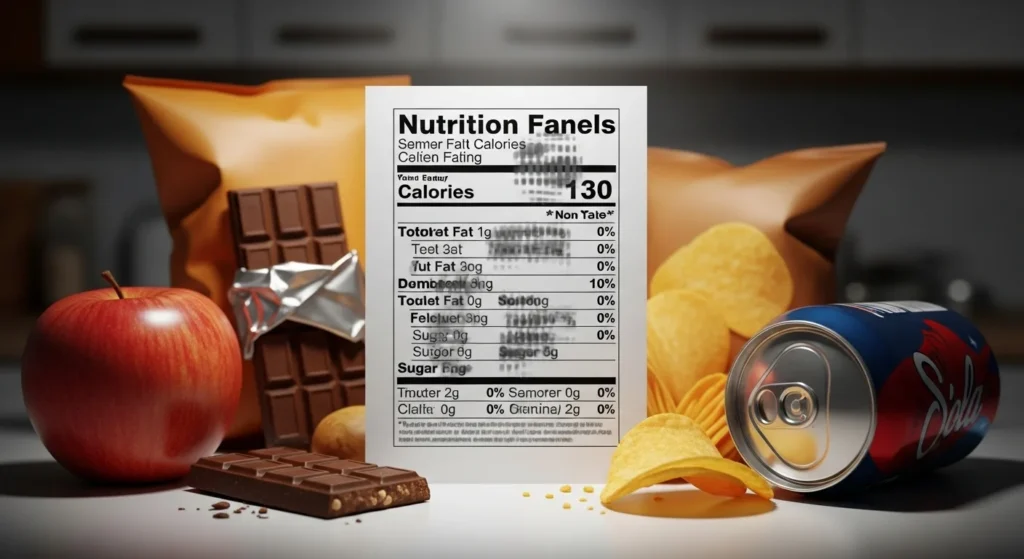
The nutrition panel looks clean, precise, scientific—even reassuring.
Numbers line up neatly. Percentages feel authoritative. Calories are counted down to the decimal.
And yet…
You eat it regularly.
You follow the “rules.”
But your energy dips, cravings spike, and progress stalls.
That quiet confusion isn’t your fault.
Nutrition panels don’t lie—but they also don’t tell the full story.
What they present is isolated data, stripped of context your body actually responds to. And that missing context is where most people get misled.
This article breaks down how nutrition panels hide context, why it matters today, and how to read labels with clarity instead of confusion.
Nutrition Panels Show Numbers — Not Nutritional Reality
Nutrition panels are designed to report measurable components:
- Calories
- Fat
- Carbohydrates
- Protein
- Sodium
- Select vitamins and minerals
What they don’t show is how those numbers behave inside a real human body.
Two foods can show similar numbers on paper but act completely differently once eaten.
That gap is context.
And context changes everything.
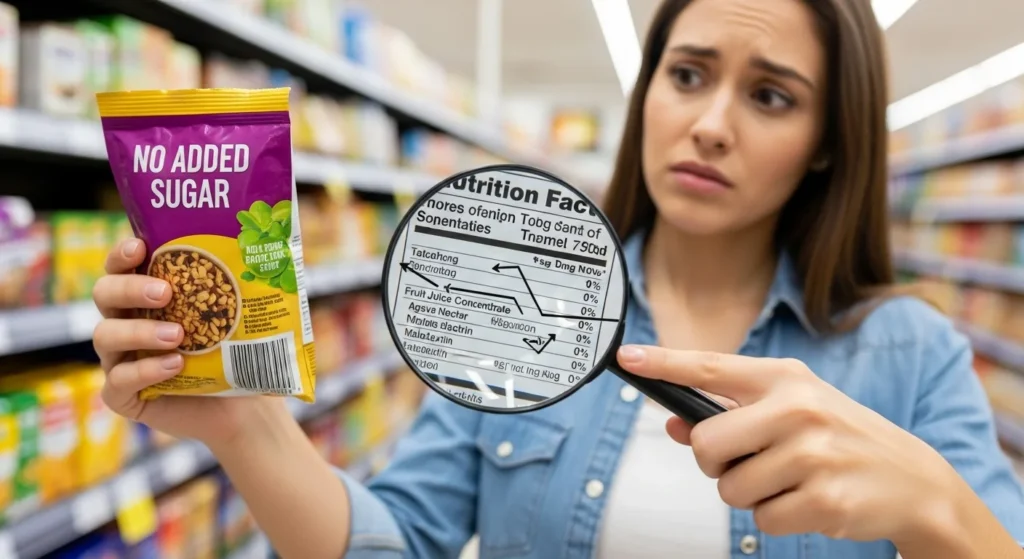
The Serving Size Trick: Where Confusion Begins
One of the most overlooked manipulations on nutrition panels is serving size.
Manufacturers choose serving sizes—not your body.
Common Serving Size Illusions
- A cookie label based on ½ cookie
- A drink bottle labeled as 2.5 servings
- Cereal portions far smaller than what most people pour
So when a label says:
“Only 90 calories!”
It may actually mean:
“90 calories per unrealistic portion.”
Why This Matters
Most people don’t eat servings—they eat packages, bowls, or plates.
When serving sizes shrink, sugar, sodium, and calories appear harmless, even when total intake isn’t.
Sugar Isn’t Just “Sugar” — But Labels Treat It That Way
Nutrition panels often list:
- Total sugars
- Added sugars
What they don’t show is how fast those sugars hit your bloodstream.
Hidden Context That’s Missing
- Liquid sugars vs solid sugars
- Refined starches that act like sugar
- Fiber-stripped carbohydrates
For example:
- Fruit sugar inside whole fruit ≠ sugar inside fruit juice
- White bread ≠ whole grain bread, even if carbs look similar
The label collapses all of this into a single number.
Your body does not.
Fat Numbers Hide Fat Quality
Fat is often reduced to one line item:
- Total fat
- Saturated fat
But fat quality matters far more than fat quantity.
What the Panel Doesn’t Explain
- Oxidized oils from high-heat processing
- Industrial seed oils vs natural fats
- Fat combined with refined carbs (the real problem)
A low-fat label can still represent a highly inflammatory food.
And a higher-fat food can be deeply nourishing.
The nutrition panel won’t help you tell the difference.
Protein Looks Simple — But Isn’t
Protein is one of the most trusted numbers on a label.
More grams = better food, right?
Not always.
Missing Protein Context
- Amino acid completeness
- Digestibility
- Protein quality vs filler protein
Two foods with “10g protein” can have very different effects on muscle, satiety, and metabolism.
Nutrition panels don’t distinguish between high-quality protein and protein added purely for marketing.
The Fiber Illusion: When Numbers Mislead
Fiber is often used as a health badge.
But labels only show quantity, not function.
What’s Hidden
- Natural fiber vs synthetic isolated fiber
- Fiber added back after processing
- Fiber that slows digestion vs fiber that doesn’t
Some ultra-processed foods add isolated fiber solely to improve label appeal.
Your gut notices the difference—even if the panel doesn’t.
Ultra-Processing Is Invisible on Labels
One of the biggest blind spots of nutrition panels is processing level.
A label won’t tell you:
- How many industrial steps were involved
- Whether ingredients were chemically altered
- If food structure was destroyed and reassembled
Two foods with identical macros can differ dramatically in how they impact hunger, blood sugar, and long-term health.
Comparison Table: What Labels Show vs What They Hide
| What Nutrition Panels Show | What They Hide |
|---|---|
| Calories | Satiety and fullness |
| Total sugar | Blood sugar impact |
| Total fat | Fat quality |
| Protein grams | Protein usability |
| Fiber grams | Fiber function |
| Sodium mg | Processing source |
| Vitamins added | Nutrient absorption |
| Serving size | Real consumption patterns |
This gap explains why “label-perfect” diets often fail.
Why This Matters Today (More Than Ever)
Modern food environments are optimized for label compliance, not biological health.
Food companies don’t need to make food nourishing.
They need to make it label-defensible.
That’s why:
- “Low sugar” foods still trigger cravings
- “High protein” snacks don’t keep you full
- “Healthy” packaged foods feel unsatisfying
Understanding context restores your ability to choose wisely—without fear, guilt, or obsession.
Common Mistakes People Make When Reading Nutrition Panels
Avoid these traps:
- Trusting front-of-pack claims over ingredients
- Comparing foods only by calorie count
- Ignoring serving size realism
- Assuming fortified nutrients equal natural ones
- Believing numbers automatically equal health
These mistakes are learned—not personal failures.
How to Read Nutrition Panels Smarter (Actionable Steps)
1. Check Serving Size First
Ask: Would I realistically eat this amount?
2. Scan Ingredients Before Numbers
Shorter lists often beat cleaner macros.
3. Watch Sugar Sources, Not Just Grams
Look for syrups, concentrates, and refined starches.
4. Treat Fiber Claims Carefully
Added fiber ≠ whole-food fiber.
5. Ask the Context Question
“How processed is this food—and how often should I eat it?”
Hidden Tip: When Labels Matter Less
Nutrition panels are most useful when comparing similar foods, not deciding health overall.
Compare:
- Two yogurts
- Two breads
- Two snacks
Don’t use them to justify ultra-processed foods as “healthy.”
Key Takeaways
- Nutrition panels show data, not biological impact
- Serving sizes distort real intake
- Sugar, fat, and protein lack quality context
- Processing level is invisible on labels
- Smarter reading restores control without obsession
Understanding context turns labels from traps into tools.
Frequently Asked Questions
1. Are nutrition panels intentionally misleading?
Not exactly—but they’re designed for compliance, not education.
2. Should I ignore nutrition labels entirely?
No. Use them with context, not as the final authority.
3. Is “low calorie” always better?
Not if it sacrifices satiety and nutrient quality.
4. Do added vitamins make food healthy?
Fortification doesn’t replace natural food structure.
5. What matters more than numbers?
Ingredients, processing level, and how food makes you feel.
Final Thoughts: Labels Aren’t the Enemy — Misinterpretation Is
Nutrition panels were never meant to replace judgment.
They’re reference points—not decision makers.
When you understand what’s missing, labels lose their power to confuse—and gain their proper role: one small piece of a much bigger picture.
Disclaimer: This article is for general educational purposes only and does not replace personalized nutrition or medical advice.

Pingback: Why Similar Foods Look Completely Different on Labels — And What’s Really Happening
Pingback: Why “Zero” Claims on Food Labels Can Be Misleading — And What They Don’t Tell You
Pingback: Why Food Labels Rarely Reflect How We Actually Eat — And Why That Mismatch Matters