You open a bag of chips, glance at the label, and see “150 calories.” Relieved, you eat what feels like a normal handful-and-a-half while watching TV. What you probably didn’t clock is that “150 calories” wasn’t describing the bag. It was describing about 11 chips — a serving size decided years ago by a formula, not by how much anyone actually eats in one sitting.
This is the quiet trick serving sizes play on all of us. They look like nutrition information. They function more like a unit of measurement chosen to make the numbers on the front of the label look smaller and more forgivable than reality. And because almost nobody checks “servings per container” before digging in, the gap between what we think we’re eating and what we’re actually eating tends to be enormous.
Serving Sizes Aren’t Recommendations — They’re a Formula
Here’s the part that surprises most people: the serving size on a Nutrition Facts label was never meant to tell you how much you should eat. It’s an estimate of how much people typically do eat, based on government survey data.
The FDA calls this number the “Reference Amount Customarily Consumed,” or RACC. Every food category — cereal, soda, yogurt, snack mix — has its own RACC, and manufacturers are legally required to base the printed serving size on it. These reference amounts were originally built in the early 1990s using national food consumption surveys from the late 1970s and late 1980s. Eating habits obviously don’t freeze in time, so in 2016 the FDA issued a final rule updating RACCs to better reflect how Americans actually eat, effective July 26, 2016, using more recent national health survey data.
That update mattered because the old numbers had drifted far from reality. One of the clearest examples: the reference amount for beverages had been stuck at 8 fluid ounces since the 1990s. The 2016 rule changed the beverage reference amount to 12 fluid ounces — a full-can pour, not a small juice-glass pour — because that’s closer to what people were genuinely drinking in one sitting.
This is the piece that changes how you should read every label going forward: a serving size isn’t a suggestion for portion control. It’s a technical reference point built from consumption data, and it can still be a lot smaller than what ends up on your plate.
The 20-Ounce Soda Bottle Problem
Nothing illustrates the disconnect between label and reality better than a bottle of soda.
Before 2016, a 20-ounce bottle of soda was still measured against the old 8-ounce reference amount, which meant the label technically described it as 2.5 servings — even though almost everyone drank the whole bottle in one go. Manufacturers weren’t lying, exactly. They were following outdated math that made a full bottle look like two and a half smaller drinks.
The FDA eventually recognized this gap and rewrote the rules for what counts as a “single-serving container.” Under current guidance, a 20-ounce bottle of soda is now defined as a single serving and labeled “1 bottle,” because it falls within 200% of the updated 12-ounce reference amount for carbonated beverages. In other words: regulators looked at real behavior, agreed that people drink the whole thing, and updated the label to match.
But that fix only applies to products that fall under specific size thresholds — and plenty of common items still don’t. A can of soda, a bag of chips, a pint of ice cream, and countless snack packages sit in a gray zone where the container legally holds “more than one serving,” even though most people treat it as one sitting. That’s exactly where serving size numbers quietly distort your perception: the calorie count you glance at may only apply to a fraction of what’s actually in your hand.
Why “Servings Per Container” Is the Line Everyone Skips
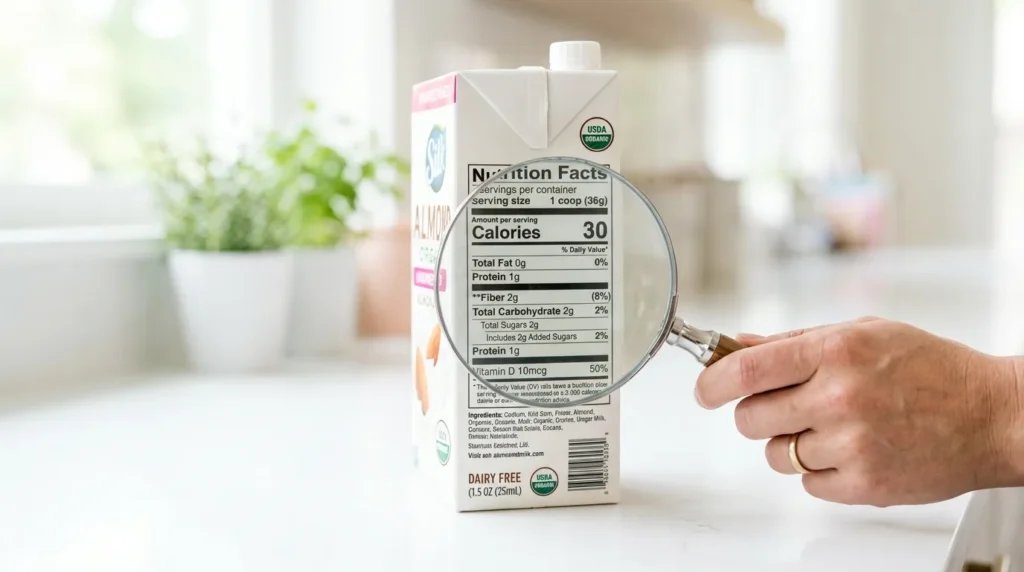
Every Nutrition Facts label has a line above the calorie count that says something like “Servings Per Container: 2.5.” It’s small, unglamorous, and it’s the single most important number on the entire label — because it’s the multiplier that turns the misleadingly modest “per serving” figures into what you’re really consuming if you finish the package.
A pint of ice cream is a great example. If the label lists 190 calories per serving with 4 servings per container, and you settle in to eat half the pint while watching a movie — which is an extremely normal amount for a “treat night” — you’ve actually eaten roughly 380 calories, not 190. Nothing on the label lied. But nothing on the label made that math obvious, either, unless you deliberately multiplied it yourself.
This is precisely why packages containing between 200% and 300% of a food’s reference amount are now required to use dual-column labeling — one column for a single serving, one for the entire container — so the “eat the whole thing” outcome is at least visible side-by-side with the smaller number. It’s a meaningful fix, but it only appears on certain package sizes, and it still requires you to actually look at the second column instead of anchoring on the first, smaller one.
The Psychology: Why We Treat “One Package” as “One Portion”
Even when the numbers are printed clearly, something in human psychology pushes us to treat a single package, bowl, or plate as the “correct” amount to eat — regardless of how much food is actually in it. Researchers call this unit bias.
In one of the foundational studies on this effect, psychologists at the University of Pennsylvania set out a bowl of candy next to either a small scoop or a large scoop and let people serve themselves freely, with no cost or limit on how many scoops they could take. Despite having the large scoop available, participants still took just a single scoop — and ended up eating roughly twice as much candy simply because that one scoop happened to be bigger. The size of the “unit” — one scoop, one bag, one bottle — quietly overrode any conscious calculation of how much they were actually eating.
This isn’t a one-off finding. A broader review of portion-size research found that consumption increases by an average of 35% when portion sizes are doubled — and this effect shows up across wildly different foods, from pasta to sandwiches to pre-packaged snacks. The pattern is consistent: give people a bigger unit, and they don’t scale their intake down to compensate. They eat closer to the whole unit, because their brain has already decided that “one of these” is the appropriate amount.
Serving sizes and package sizes exploit this instinct perfectly, whether or not it’s intentional. A larger bag of chips doesn’t just contain more chips — it recalibrates what your brain accepts as “a normal amount to finish.”
Serving Size vs. Portion Size: A Distinction Worth Keeping Straight
Part of what makes this confusing is that two related terms get used almost interchangeably in everyday conversation, even though they mean very different things.
A serving size is the fixed, standardized amount printed on a label — the same for every box of that product, regardless of who’s eating it. A portion size is whatever amount you actually put on your plate or eat in one sitting, and it can be larger or smaller than the serving size by a wide margin. As nutrition experts frequently point out, a portion size is simply how much of a food you eat, whether that ends up being more or less than the official serving size.
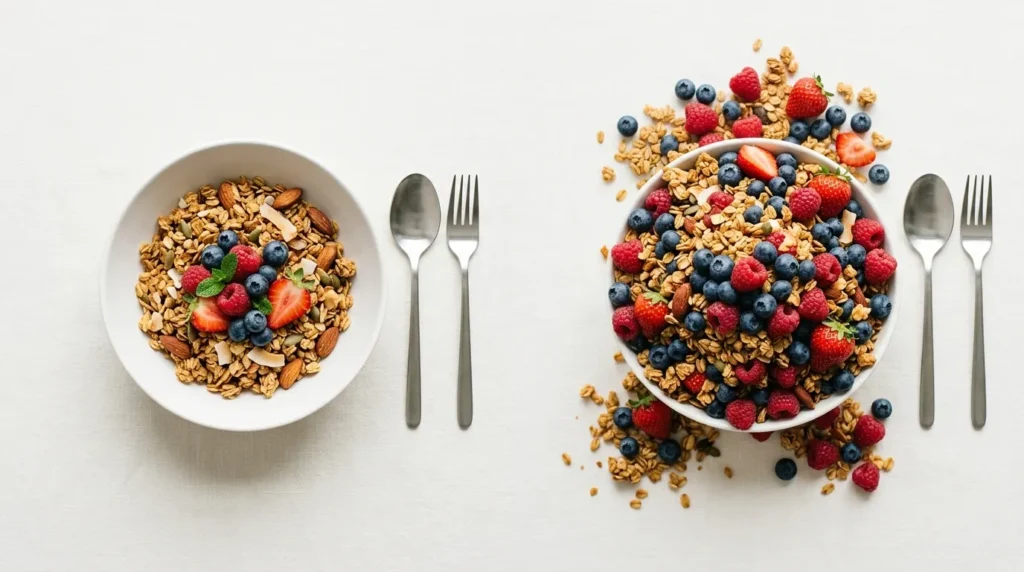
The gap between the two is often where people lose track of their actual intake. A portion is the amount of food you put on your plate; a serving is an exact, standardized amount — and unless you’re actively measuring, there’s no guarantee the two ever line up. Almonds are a classic example: the standardized serving is about 23 almonds, but most people pouring “a handful” straight from the bag are eating a portion closer to double that, with double the calories, without any sense that they’ve drifted from the label at all.
A Practical Way to Read Past the Trick
None of this requires giving up convenience foods or treating every snack like a math problem. It just requires reading labels in the right order.
1. Find “servings per container” before you look at calories. This number tells you what multiplier you’re really working with. A “low” calorie count per serving means very little if the container holds four servings and you’re about to eat the whole thing.
2. Multiply before you decide if a number is “good.” If a granola bar lists 120 calories per serving and the package contains 1.5 servings, that’s the number that matters for judging whether it’s a light snack or most of a meal — not the number printed in large font.
3. Compare the printed serving size to what you’d actually eat. If a bag of chips lists a serving size of 11 chips and you know you typically eat closer to 30, do the math on your real portion rather than trusting the front-of-label calorie count to represent your experience.
4. Watch for dual-column labels — and read both columns. When you see two columns side by side, the second one (usually “per container”) is the one that reflects what happens if you finish the package, which for many snack foods is the realistic outcome.
5. Use visual anchors instead of guesswork for fresh food. For items without a label — a bowl of pasta, a scoop of rice, a slice of cheese — comparing the amount to an everyday object (a fist, a deck of cards, a pair of dice) is a far more reliable gut-check than eyeballing a plate.
The Bigger Picture
Serving sizes exist for a reasonable purpose: they let you compare nutrition information across products using a standardized unit. The problem isn’t that they exist — it’s that they were never designed to match how food is actually packaged, sold, or eaten in a single sitting, and human psychology fills that gap by nudging us to treat “the package” as “the portion,” regardless of what the fine print says.
Reading past that trick doesn’t take long. It just takes remembering that the biggest number on the label isn’t calories — it’s the servings per container multiplying quietly in the background, whether you check it or not.
Sources
- FDA – Guidance for Industry: Serving Sizes of Foods That Can Reasonably Be Consumed at One Eating Occasion
- Federal Register – Food Labeling: Serving Sizes Final Rule (2016)
- Mayo Clinic – Portion Control for Weight Loss
- Cleveland Clinic – Portion Sizes: How Much Are You Really Eating?
- Health Psychology (SAGE Journals) – Geier, Rozin & Doros, “Unit Bias: A New Heuristic That Helps Explain the Effect of Portion Size on Food Intake” (2006)

Aarti Solanki, B.Sc. (Food Science), is a food science writer passionate about making nutrition simple and evidence-based. She creates well-researched, easy-to-understand articles on healthy eating, food science, and nutrition, using information from trusted scientific and public health sources.

Pingback: Why Percent Daily Values Cause Confusion — The Nutrition Numbers That Feel Helpful but Often Mislead
Pingback: Why Nutrition Panels Don’t Tell the Whole Truth — And What Food Labels Leave Out
Pingback: Why Food Labels Rarely Reflect How We Actually Eat — And Why That Mismatch Matters
Pingback: How “No Added Sugar” Can Still Mean Sweet — The Label Trick Most People Don’t Catch